Do not buy a random stock blindly. Learn how to read a balance sheet in simple language — assets, liabilities, equity, and 3 key ratios every investor must know.
Let me ask you something honest.
Before your last stock purchase — did you actually look at the company’s financials? Or did you go by a tip, a YouTube video, or gut feeling?
If it’s the second one, you’re not alone. But here’s the hard truth: **buying a stock without reading the balance sheet is like buying a car without checking the engine.**
The good news? It’s not as scary as it looks. Let me break it down for all f you simply, quickly, and in a easy way that actually sticks.
What Is a Balance Sheet?
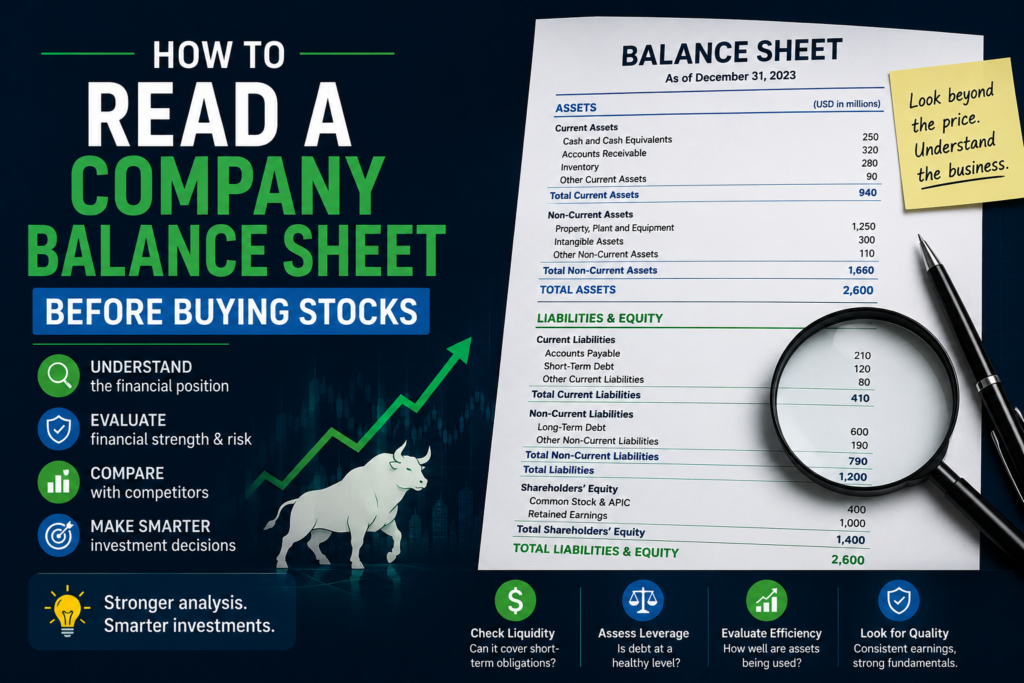
A balance sheet is a financial snapshot of a company at a single point in time. It answers three questions:
- What does the company own? → Assets
- What does the company owe? → Liabilities
- What’s left for shareholders? → Equity
And it always follows one golden rule:
Assets = Liabilities + Shareholders’ Equity
That equation must always balance. Always.
Phase 1: Assets means What the Company Owns
Assets are mainly split into two types:
1.Current Assets (convertible to cash within a year)
- Inventory (unsold goods)
- Cash & Cash Equivalents
- Accounts Receivable (money owed by customers)
Non-Current Assets(long-term):
- Intangible Assets (patents, brand value)
- Goodwill (from acquisitions)
- Property, Plant & Equipment
What to look for Is cash growing? Is inventory piling up unsold? Rising cash = healthy sign. Piling inventory = warning sign.
Phase 2: Liabilities means What the Company Owes
Current Liabilities basically (due within 12 months):
- Accounts Payable means owed to suppliers
- They haveShort term Debt
- They have Accrued Expenses
Non-Current Liabilities basically (due after a year):
- – They have Long-term Debt
- – Lease Obligations
What to look for Is debt rising faster than revenue? A company carrying manageable debt to grow is fine. But debt that’s spiraling with no earnings growth? That’s a slow-moving disaster.
Phase 3: Shareholders’ Equity means What’s Yours
This is what’s left after all debts are paid. It includes:
Retained Earnings profits kept in the business over time. This is the most important line here.
Common Stock & Paid-in Capital— money raised from issuing shares
Treasury Stock— shares bought back by the company (shown as negative)
What to look for Is shareholders’ equity growing year over year? If yes — the company is building real value. If it’s shrinking or negative — that’s a serious red flag.
3 Ratios That Tell You Everything
You don’t need to memorize every number. Focus on these three:
1. Current Ratio — Can They Pay Their Bills?
Formula for find current ratio = Current Assets ÷ Current Liabilities
then show result so whats that means?
- If above 2 it is Healthy — plenty of cushion
- If between 1 to 2 is Acceptable
- If Below 1 it is Danger — may stock struggle to pay debts
2. Debt to Equity Ratio means How Much Debt Are They Carrying?
Formula for find debt equity ratio = Total Debt ÷ Shareholders’ Equity
- If Below 1→ Low risk, conservative
- If between 1–2 → Moderate, watch cash flow
- If Above 2 → High leverage — be careful
Remember: Some industries are like real estate or telecom, naturally carry more debt. Do reasearch and always compare within the same industry.
3. Book Value Per Share menas basically Is the Stock Fairly Priced?
Formula for find book value = Shareholders’ Equity ÷ Total Shares Outstanding
It is compare this to the current market price. If a stock trades *below* book value, it might be undervalued. If it trades far above, the market is paying a premium — make sure the company’s growth justifies it.
4 Red Flags You Should Never Ignore
This is where real money is protected. see for
their Debt growing faster than revenue means unsustainable path
Cash reserves shrinking every quarter means burning through money with no return
Negative shareholders’ equity means the company technically owes more than it owns
Accounts receivable growing faster than sales means customers aren’t paying on time, hurting cash flow
If you spot even two of these together means step back and ask hard questions before investing.
Where to Find Balance Sheets for Free choose
For Indian Stocks website like
- Screener.in Best free tool
- BSE India / NSE India for official fillings
- Moneycontrol or Tickertape app or websites
For US Stocks website like
- Macrotrends.net
- SEC EDGAR
Always look for the Annual Report or Quarterly Filing.The balance sheet is always inside.
The One Thing Most Beginners Miss
Numbers don’t lie — but they don’t tell the full story either.
Always compare a company’s balance sheet:
1. To its own past — improving or declining?
2.To competitors — how does it stack up?
3. In the right industry context— high debt is normal for some sectors, fatal for others
A balance sheet is a clue, not a verdict. Use it alongside the Income Statement and Cash Flow Statement for the full picture.
Final Thought
You work hard for your money.The least you can do before putting it into a stock is spend 10 minutes reading a balance sheet.
It won’t make you perfect. But it will make you *informed*. And in investing, informed beats lucky — every single time.
Start with one company today.Pull up their balance sheet. Run the three ratios. Look for the red flags.
That one habit could save you from your worst investment — and lead you to your best.
Quick FAQs
Q: How often should I check the balance sheet?
At minimum, check the annual one before investing. Revisit quarterly if you already hold the stock.
Q: Is one good balance sheet enough to buy a stock?
No. It’s one piece of the puzzle.Always check the income statement and cash flow statement too.
Q: Best free tool for Indian investors?
Screener.in — clean, simple, and shows 10 years of data for free.